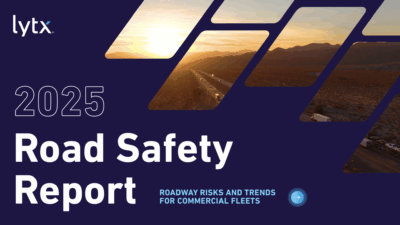
Lytx’s 2025 “Road Safety Report” Delivers Top Roadway Risks and Trends for Commercial Fleets. While industry-wide collision rates per vehicle increased 24% from Q4 2023 through 2024, Lytx data shows a reduction in severity and overall risky driving behaviors amongst clients
SAN DIEGO, June 24, 2025 /PRNewswire/ — Lytx® Inc., the industry pioneer of video and safety-driven efficiency, today released its reimagined 2025 “Road Safety Report” (previously “State of the Data”), analyzing over 300 billion miles of driving data to reveal critical insights into road safety trends and emerging risks for commercial fleets. Highlighted in this year’s report is that after a steady decline between 2018 and 2020, coming out of the COVID lockdown, collision rates and risky driving behaviors have been rising back up since 2023.
This year’s report highlights the latest collision trends, risky driving behaviors, riskiest locations and times to drive, the positive impact of safe driving, and the growing need for fleets to address these rising risks through advanced technology and coaching. As roadway dangers evolve, Lytx continues to lead by providing actionable data that helps fleets proactively mitigate risks and enhance driver safety.
“The Lytx 2025 Road Safety Report is a powerful reminder that as our roads continue to see increased volumes of traffic, the nature of risk is evolving,” said Peter Goldwasser, Executive Director at Together for Safer Roads. “What this data makes clear is that better understanding and proactive management of these new patterns of risk is critical. At Together for Safer Roads, we believe insights like these are key to shaping smarter, more responsive safety strategies for fleets, cities, and policymakers alike.”
Key Highlights Include:
- Collision Rates and Severity: Despite a 24% increase in industry-wide collision rates per vehicle from Q3 2023 through Q4 2024, Lytx’s data shows a significant reduction in the more severe collision levels in comparison to 2023.
- Level 1 (highest severity) collisions saw a decrease of 6%, while Level 2 (moderate severity) collisions dropped by 59%, demonstrating improved driver safety through proactive coaching and technology.
- Also contributing to the drop in severity is a 4% reduction in overall risky behavior in 2024 among drivers equipped with Lytx technology.
- Near Collisions: “Close calls” and near collisions also increased, up 52% when comparing Q4 2024 to Q4 2023, as roads have become increasingly congested.
- Risky Driving Behaviors: Following too close, use of handheld device, not wearing a seat belt, and speeding continue to top the list of riskiest driving behaviors. Notable increases and decreases from 2023 to 2024 include:
- Speed violation (+9%)
- Food or drink (+7%)
- No seat belt (-13%)
- Handheld device (-9%)
- Following Distance: Following distance (1-2 seconds) increased 2% from 2023 to 2024, while following distance (less than 1 second) rose by 19%, highlighting a need for companies to reinforce following distance policies through coaching and communication.
- The Impact of Weather: Driving “too fast for conditions” made drivers 4x more likely to be in a Level 1 incident and was the top factor in severe inclement weather collisions.
- Fog is the most dangerous weather condition, increasing Level 1 collision likelihood by 2.8x.
- Due to its unfavorable weather conditions, winter carries double the risk for collisions compared to other seasons.
- Fuel Efficiency and Speeding: In 2024, Lytx clients showed an 8.7% reduction in time spent speeding per vehicle, which helped fleets decrease fuel costs.
- Sustainability Impact: By driving more efficiently, Lytx clients saved an estimated $22 million* in fuel in 2024 and prevented 110 million pounds** of CO2 emissions.
- Customer Impact: In 2024, Lytx fleet customers achieved several milestones, including:
- Saved an estimated $1.8 billion*** on claims costs, including workers compensation and insurance claims.
- Realized an estimated $521 million*** savings on vehicle maintenance.
Top 10 Risky Driving Behaviors
- Following distance (1-2 seconds from vehicle ahead)
- Handheld device
- No seat belt
- Posted speed violation
- Following distance (1 second or less from vehicle ahead)
- Incomplete stop
- Food or drink
- Driver unbelted (roadway)
- Failed to stop
- Inattentive
Top 5 Riskiest States for Driving
| 2024 Ranking | Change from 2023 Ranking |
| 1. California | 0 |
| 2. Texas | +1 |
| 3. New York | -1 |
| 4. Florida | 0 |
| 5. New Jersey | +1 |
Top 5 Riskiest U.S. Cities/Districts for Driving
| 2024 Ranking | Change from 2023 Ranking |
| 1. New York, NY | 0 |
| 2. Los Angeles, CA | 0 |
| 3. Dallas/Fort Worth, TX | +3 |
| 4. Chicago, IL | -1 |
| 5. Washington, D.C. | +5 |
Riskiest Days and Times to Drive + Holiday Insights
- Tuesdays are the riskiest days to drive in the U.S. in 2024. Sundays are the safest.
- Mid-week driving carries the most driving risk, while weekend driving is the safest.
- Risks were elevated between 11 a.m. and 3 p.m., peaking at 2 p.m.
- New Year’s Eve proved to be 2024’s riskiest day (and holiday) to drive in the U.S.
- Christmas Day (2023’s riskiest day and holiday to drive) was a close second.
- Overall, there was a 12% increase in collisions on major U.S. holidays when compared to the same day of the week across the rest of the year.
“Today’s fleets and drivers face rapidly changing risk environments,” said Rajesh Rudraradhya, Chief Technology Officer at Lytx. “To stay on top of these changes, managers need real-time data insights and advanced tools that can help them identify and address emerging risk patterns.”
In addition to the interactive version, a video version of Lytx’s “2025 Road Safety Report” is also available for viewing.
About the Data
The insights for Lytx’s “2025 Road Safety Report” were collected from its industry-leading global driving database, which consists of over 300 billion miles of processed data from more than 5.5 million drivers traveling across 90+ countries. In 2024, Lytx labeled and analyzed over 209 million new driving events and captured over 106 million driving behaviors with its DriveCam® event recorders.
*Based on 2024 average $3.76 per gallon of diesel, according to the U.S. Energy Information Administration.
**Figure is based on fuel saved through client reduction in unnecessary idling in 2024.
***Results not guaranteed and vary by client. These numbers are Lytx internal, based on sampling of client claims data.
About Lytx
Lytx is a global leader in video safety and video telematics. Our solutions harness the power of video to empower drivers and fleets to be safer and more efficient, productive, and profitable so they can thrive in today’s competitive environment. Through the Lytx Vision™ Platform, direct and reseller clients access our customizable services and programs spanning fleet safety, risk detection, fleet tracking, ELD compliance, preventative maintenance, and fuel management. Using the world’s largest driving database of its kind, along with proprietary machine vision and artificial intelligence technology, we help protect and connect thousands of fleets and over 5.5 million drivers in more than 90 countries. For more information about Lytx, visit www.lytx.com, @lytx on X, LinkedIn, our Facebook page, or our YouTube channel.


